
What does the Housing Ombudsman data show?
In this article, Sue Harvey, Director, and Catherine Romney, Policy & Research Officer at Campbell Tickell, analyse the Housing Ombudsman’s landlord data and what insights housing providers can draw from this.
Outline of key sections:
Driving improvement
Since December 2020 the Housing Ombudsman Service (HOS) has been publishing all of its determinations, and in 2022 it published its first set of Landlord Performance Reports. These reports contain a wealth of information for every landlord with five or more Ombudsman determinations in that year. In October 2023, the second set of annual reports was published [i], with 163 social landlords having a spotlight shone on their interactions with the Ombudsman.
As the accompanying Annual Complaints Review [ii] describes, the volume of complaints received by the Ombudsman has risen sharply, up 27% from 2021-22. With the proportion of negative landlord findings also increasing, up to 55% from 43%.
The Ombudsman’s commitment to transparency has undoubtedly already contributed to an increase in the visibility and accessibility of HOS’s services, with a heightened focus on incidences of very poor quality homes and services to residents, common themes, and lessons to be learned. The Landlord Performance Reports have the potential to drive improvements in housing associations and local authorities further still.
Opportunity for greater insights
This year the Ombudsman has placed greater emphasis on the Maladministration Rate metric (‘MalRate’), which approximates to the Failure Rate measure of 2021-22. The MalRate refers to “the number of findings of severe maladministration, maladministration and service failure, expressed as a percentage of the total number of considered findings”.
The MalRate is highlighted in each Landlord Performance Reports and underlies the headline conclusion that a landlord performs ‘very well’, ‘similarly’ or ‘poorly’. It is also used to generate the list of Landlords with High MalRates [iii]. The 90 landlords with MalRates above 50% received a letter from the Ombudsman indicating his concern and emphasising the need to resolve complaints more effectively.
The Ombudsman’s MalRate shows where the landlord was found to be at fault in a higher or lower proportion of the complaints that received an Ombudsman decision. This is just one part of the puzzle however, as critically the Ombudsman’s MalRate is silent on the volume of faults compared to the size of the landlord.
At Campbell Tickell we believe that the emphasis on poor performance could be usefully supplemented with an additional metric to the MalRate. We have been exploring what can be learnt from an Incidence metric (‘The CT Incidence Rate’) that calibrates performance to the scale of the landlord, by calculating the number of maladministration findings per 10,000 homes. We believe that this kind of a standardisation provides a sharper focus on those organisations where the Ombudsman has identified a higher proportion of a landlord’s homes and residents to be experiencing a poor quality of service.
Such a measure will also compliment the regulator’s new Tenant Satisfaction Measure 17, which will calibrate the volume of internally resolved complaints to the size of the landlord.
Analysis
Our analysis shows that across all housing association and local authority landlords with five or more findings, the average incidence of negative findings sits at 6.8 per 10,000 homes.
Whilst every maladministration finding represents both an incidence of poor-quality service that should not have happened and a dreadful experience for the residents concerned, we note that fewer than seven negative findings per 10,000 homes per annum suggests that landlord maladministration as defined by the Ombudsman is rare. This conclusion is strengthened when considered alongside the fact that approximately 65% of all landlords received no determinations in 2022-23 [iv].
Of course there is no perfect single metric and the CT Incidence Rate has shortcomings of its own. A low incidence could indicate low awareness of and poor signposting to HOS by that landlord, rather than or in addition to a higher volume of complaints, a higher dissatisfaction with complaints handling or a poorer overall quality of service.
Variation
As Chart 1 shows, the variation in the CT Incidence Rates is very large.
Chart 1. Distribution
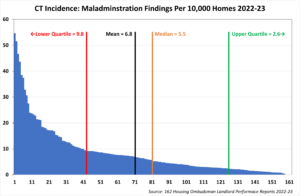
A small outlier RP has been excluded from the base data. See Notes.
Whilst the average incidence for all of the 163 landlords with five or more findings was 6.8, the worst performing landlord by our measure had over eight times the average incidence, with 55 negative findings per 10,000 units. Furthermore, off to the right of the chart there is a long tail of over 1,300 landlords with zero findings in the 2022-23 [iv].
Correlation
When we turn to look at the relationship between the CT Incidence Rate and the Ombudsman’s MalRate we find a weaker degree of correlation than we expected, given that both measurers are looking to highlight landlords with particularly good or poor performance.
Chart 2. Correlation CT Incidence vs Ombudsman MalRate
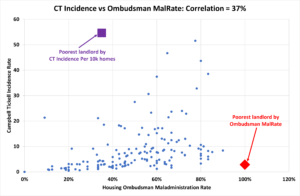
A small outlier RP has been excluded from the base data. See notes.
The poorest landlord by the Ombudsman’s MalRate measure sits in the best 30% of landlords by CT’s Incidence metric. Whilst the worst performing landlord by the CT Incidence Rate has a HOS MalRate of 35%, and so doesn’t appear at all on the Ombudsman’s worst performers list. Perhaps an opportunity to highlight poor performance has been missed.
Insights in the detail
As ever, there’s a lot of value-added hidden in the sub-categories of landlords and types of complaint. From our initial analysis we can see some differences in the CT Incidence Rate by type and size of landlord, but these variations are likely to be influenced by the long tail of landlords with zero cases, making the distinctions hard to interpret.
But one clear conclusion jumps from our examination of the CT Incidence data. That is that there is a very sizeable London effect.
On average, London landlords (both housing associations and local authorities) have an incidence of around 12 maladministration findings per 10,000 units, some 72% higher than the average across all landlords with five or more findings. This does correlate with the Ombudsman’s findings that the region has the highest MalRate and may be due to a variety of factors including a higher proportions of flats, shared owners, leaseholders and multi-freeholder buildings or greater shortages of skilled labour. It certainly merits further investigation.
Conclusion – a suggestion
The Housing Ombudsman’s landlord data provides a rich source of insights into the quality of both service provision and complaints handling.
Over time, we would all of course want the total and average incidence of maladministration findings to reduce dramatically.
The challenge as to whether having fewer negative ombudsmen determinations points to good quality of service, efficient resolution of complaints internally, poor recording of informal complaints or a lack of visibility and accessibility of the housing ombudsman service will remain.
Despite these nuances and complications, calibrating complaints data by the size of the landlord seems to us to be an opportunity to add value to this important data set.
Contact
Handling complaints: a three-part podcast mini-series
 Listen to our three part podcast mini-series about the Housing Ombudsman Complaints Handling Code and how it links in with changes to social housing consumer regulation.
Technical notes
Precise languageThe Ombudsman’s use of language is precise and care should be taken when differentiating between enquiries, complaints, determinations, findings, orders and recommendations. Click here for more information. FindingsIn each determination, the Ombudsman breaks down a complaint into the various issues of which it is comprised. The Ombudsman subsequently makes one finding against each of these individual issues. This means for instance that in a hypothetical case of a complaint consisting of seven issues, the Ombudsman would make seven different findings. ‘Considered findings’ excludes any findings that were withdrawn or found to be outside the jurisdiction of the ombudsman. Tracking performance over timeIn the 2021-22 Landlord Reports, the Ombudsman discussed a Failure Rate, which included findings of Partial Maladministration. This category is no longer reported to avoid the concealment of severe maladministration findings in a ‘mixed’ category. For the 2022-23 reports, the Ombudsman has chosen to focus on the number of issues raised in each complaint and their consequent findings. The 2022-23 Maladministration Rate now includes findings of Service Failure which is defined as “a minor failing[vi] [that requires] action to put things right”. Whilst the choice of words might indicate otherwise, service failure is a form of maladministration. It can be understood as a mistake that which has caused some determinant to a tenant and needs correcting, but not necessarily significant detriment. Service Failure findings make up 23% of all 2022-23 findings and 52% of the negative findings. It is difficult to track performance over time if definitions change between years. With the publication of the 2023-24 landlord reports expected in the autumn, it would be very useful to e able to analyse trends in the data. Excluded from our analysisWe have excluded the results of one very small RP from our analysis of the CT Incident Rate and the data depicted in Charts 1 and 2. This is because it has an extremely high incidence rate that significantly skews the distribution and concealed the poor performance of a large number of medium and large landlords. References[i] https://www.housing-ombudsman.org.uk/landlords/ [ii] https://www.housing-ombudsman.org.uk/annual-complaints-review-2022-23/ [iii] https://www.housing-ombudsman.org.uk/landlords-with-high-maladministration-findings-22-23/ [iv] CT estimate based on data provided by HOS. [v] https://www.campbelltickell.com/our-services/regulation/#1700151474201-a6d47df2-850b [vi] CT’s emphasis |