
Sue Harvey, Partner at Campbell Tickell, discusses the three key charts from the newly published Bank of England Monetary Policy Report.
Today the Bank of England released its latest Monetary Policy Report, its quarterly assessment of the outlook for the UK economy. This includes its projections for GDP, Inflation, Unemployment and the Bank Rate (the interest rate Bank pays on the deposits that it requires the commercial banks to hold with it).
There is a lot in here to digest. But as English housing associations complete their long-term business plans in time to submit to the Regulator of Social Housing at the end of September, the Bank’s projections for Consumer Price Inflation are of special interest.
The September CPI figure (published in mid-October, so after the submission date for the Financial Forecast Return) drives the maximum amount by which associations can increase their rents the following April. As such, it is one of the key economic assumptions driving those long-term plans.
Moreover, the implications are cumulative over the length of the 30–year plan. A lower (or higher) inflation figure at year one of the projections sets a new base rent level from which the following year’s increases will work. The last four years of rent reductions provided a clear demonstration of the impact of compounding.
So here are three key CPI charts from the report[1]:
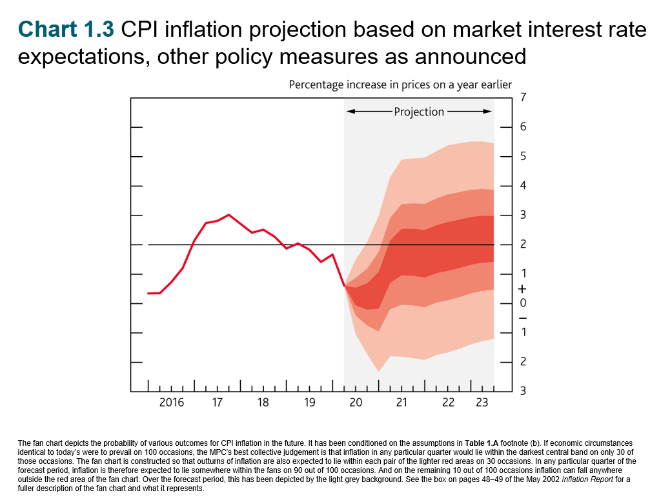
The CPI inflation forecast fan chart underlines the range of uncertainty in the Bank’s analysis. But the modal (central) projections for Q3 are:
|
Year |
2020 | 2021 | 2022 | 2023 |
|
Q3 CPI |
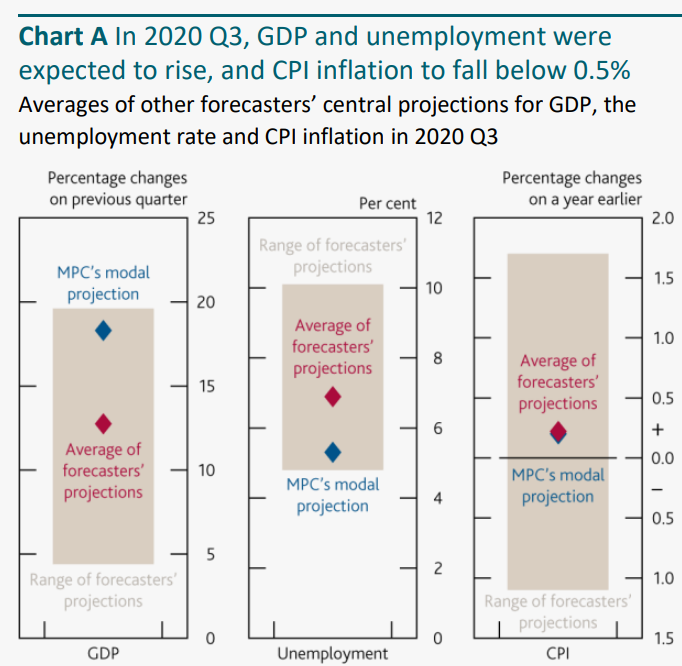
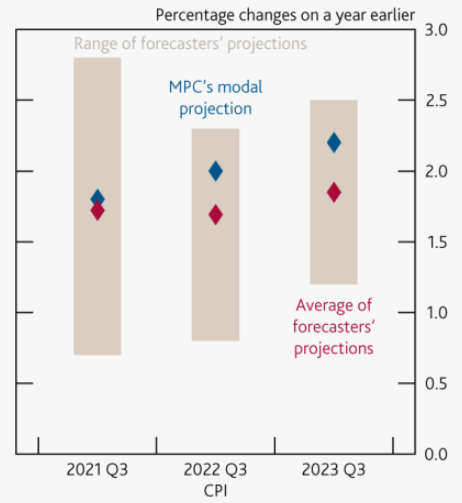
0.25% | 1.81% | 1.97% | 2.22% |
If this were to come to pass, rent increases in April 2021 would be capped at 1.25%.
The average of 20 other forecasters’ expectations for 2020 Q3 CPI are just a smidgen lower that the Banks at 0.2%.
But for the following years, the average of those other forecasters’ expectations are significantly lower than the Bank’s at 2021=1.7%, 2022= 1.7% and 2023=1.9%.
It should be noted that the BoE’s projections are based on assumptions that lockdown continues to ease and that there is a smooth transition to a new free trade agreement with the EU. The report notes that the risks are skewed to the downside, with the impact most likely being to further reduce CPI in the short-term, as the fan chart illustrates.
There is a strong case for associations to use the BoE’s central projections in the base case of their new financial plans. And also, for using the average projections of other forecasters as part of their suit of stress tests. This may drive difficult trade-offs in other parts of the plan, but it would be prudent.
The full report can be found here and the accompanying charts and tables here.
[1] The Bank does not project the September CPI, it works on calendar year quarters, and usefully highlights the Q3 (September to December) projections. Given the shape of the curve, one might expect that the September CPI will be slightly lower that the Q3 average for 2020, but slightly higher in subsequent years.
To discuss how Campbell Tickell can provide external assurance and challenge to your business planning and stress testing, contact Sue on: sue.harvey@www.campbelltickell.com
| Campbell Tickell is an established multi-disciplinary management and recruitment consultancy, operating across the UK and Ireland, focusing on the housing, social care, local government, sport, leisure, charity and voluntary sectors.
We are a values-based business and firmly place the positioning of our support and challenge on helping organisations to attain change that is well thought through, planned and sustainable. At CT, we want to help organisations create the landscape within which we ourselves would like to exist: fair, inclusive, diverse, engaged and transparent. We build from our values in how we approach all our work as a practice. Find out more about our Risk, Audit & Assurance services. |